Wandering Lines - Move Until a Collision
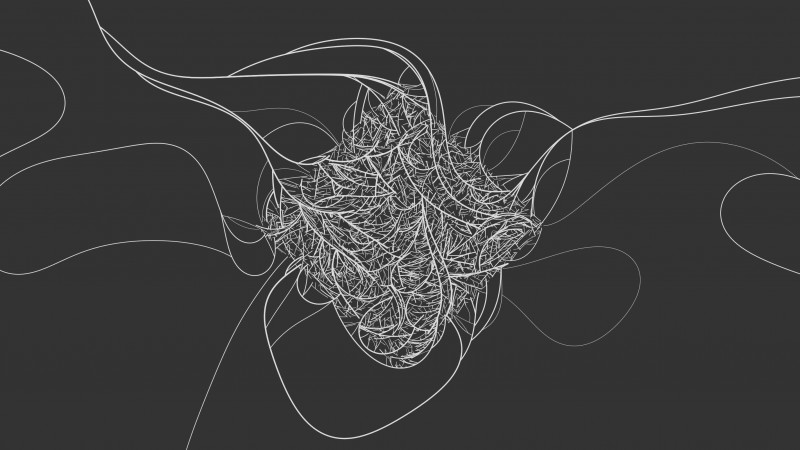
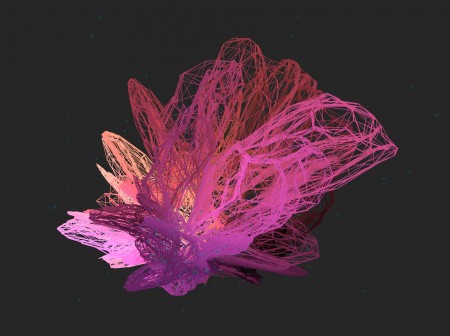
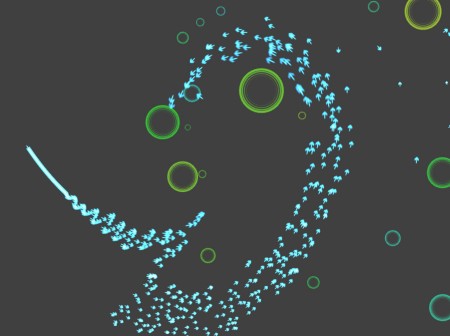
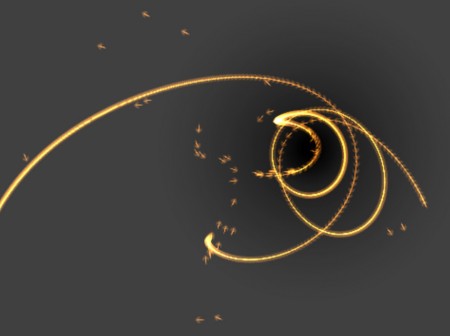
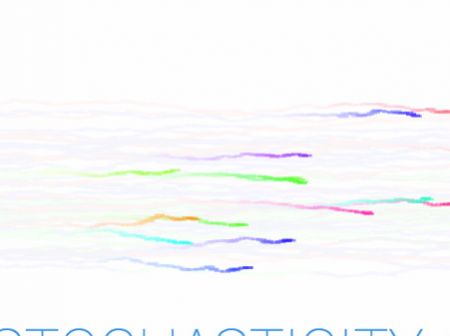
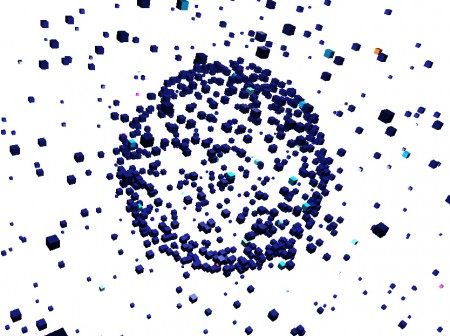
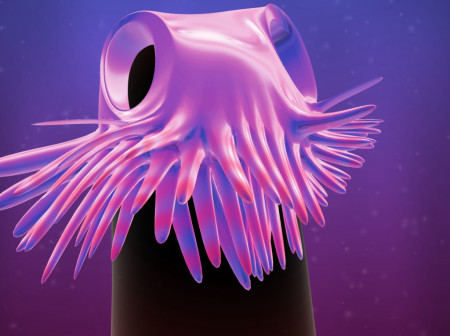
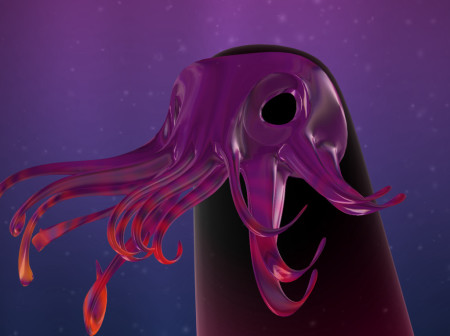
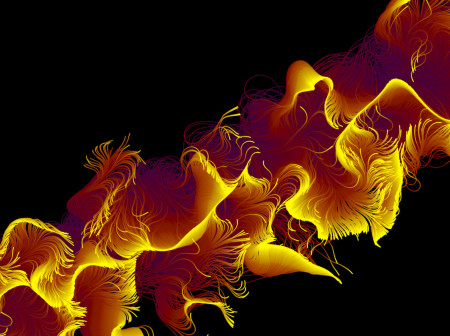
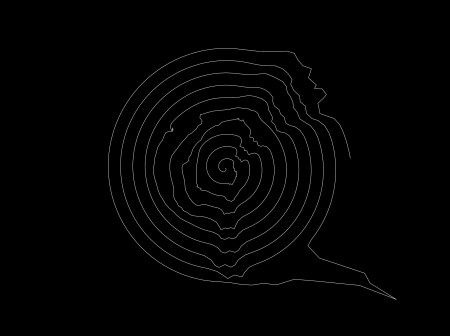
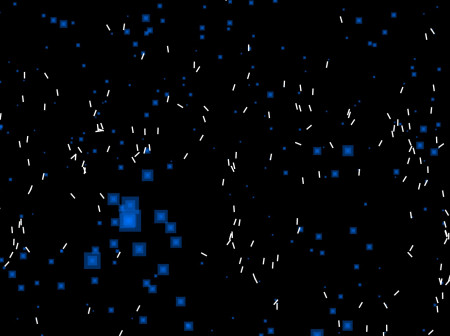
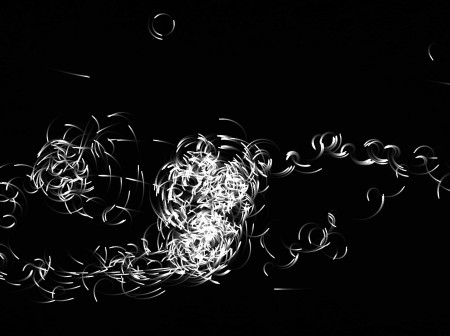
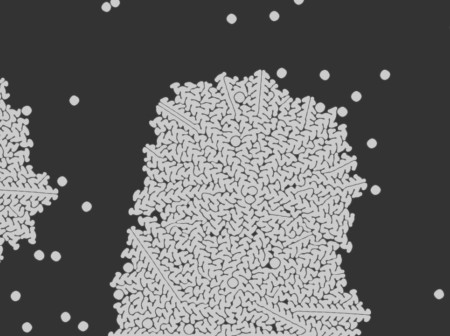
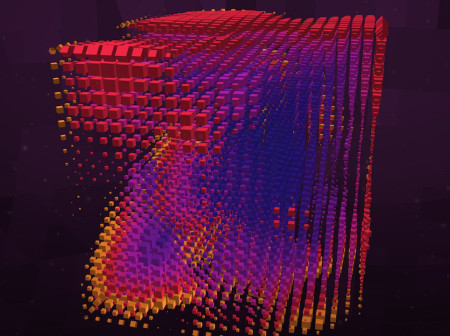
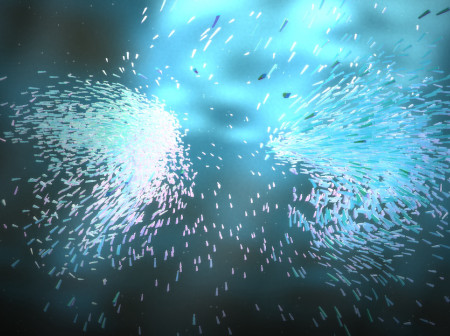
Having been inspired by the work of Anders Hoff, I decided to try my hand at doing some algorithmic line growth. With this piece lines wander through a 3d noise field until they collide with an existing line. The lines regenerate in a diamond space.
Video of Visualization
About the Code
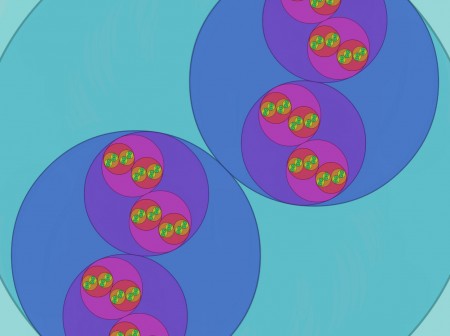
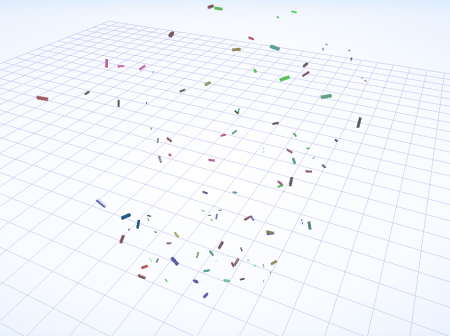
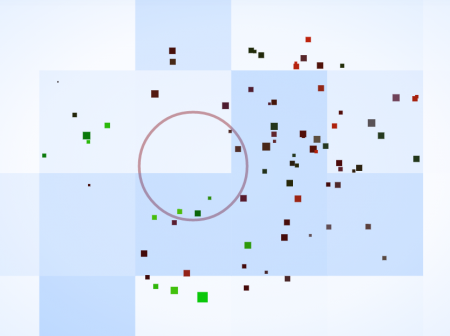
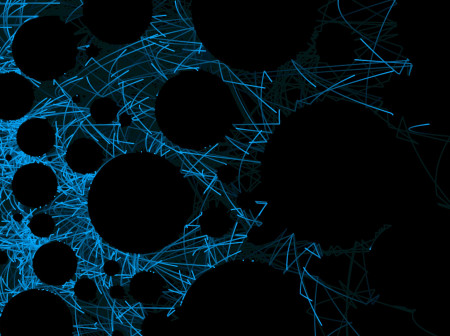
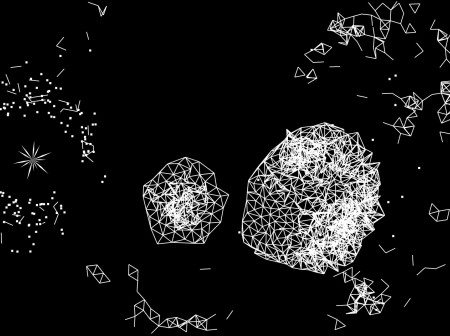
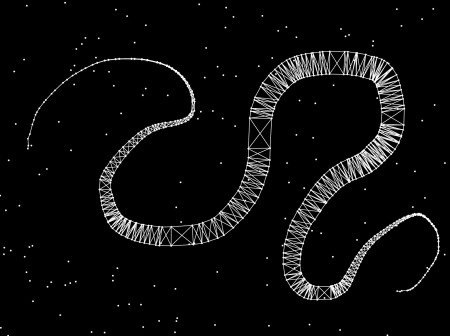
Drawing lines is interesting because the moment you draw more than one, and care about how they interact, you have a fairly intense algorithm to solve. In Big O notation this would be O(n^2). Luckily I remembered a pretty nice write up by Mikola Lysenko on this very subject. Lines are 2 points connected together, and the space they are broken up into can be represented by a box. Game developers have come up with lots of optimizations for this type of set up. I decided to go for an R-tree look-up. Theoretically it can get the complexity down to O(log n). I went with the nice rbush module for my R-tree implementation based on Mik’s write up, which showed some very favorable results.
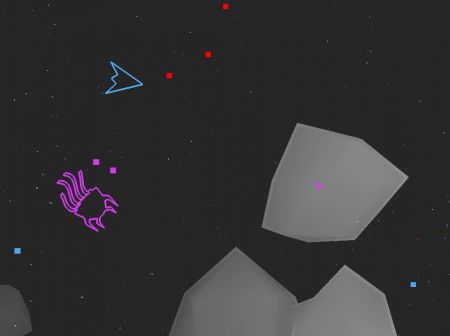
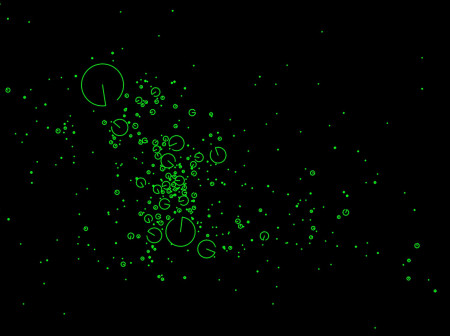
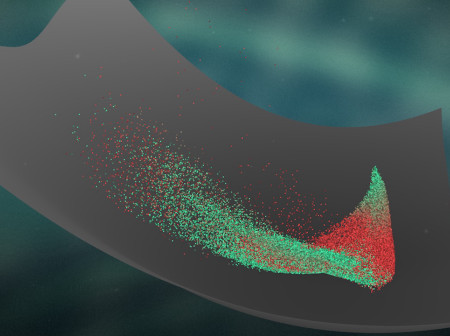
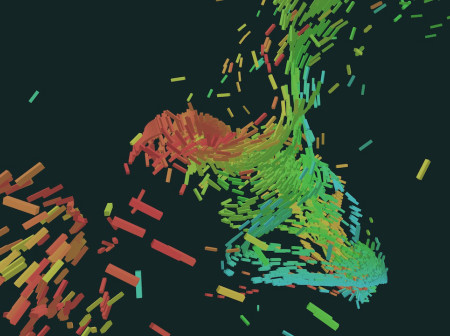
In general O(n^2) algorithms are pretty scary to write as you can’t add as many entities on the screen at once, so I went ahead and optimized this piece away. The first step was to build up my R-tree graph of line additions as the lines are accumulated on the screen. However, even if the line’s bounding boxes intersect, it doesn’t necessarily mean that the lines themselves are intersecting. The next step was to figure out if two line segments collide. Surprisingly I found this difficult to figure out. It seems like an easy problem, but I had to do lots of searching to finally come to a solution. Ultimately it’s abstracted away to a pretty simple function. After writing some simple test visualizations I was finally on my way to play around with the algorithm.
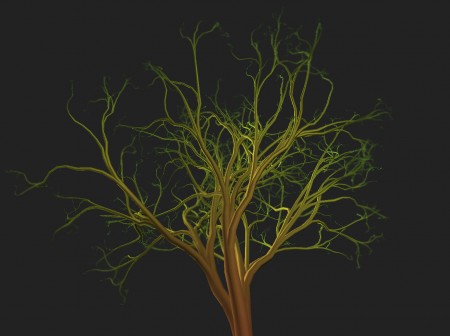
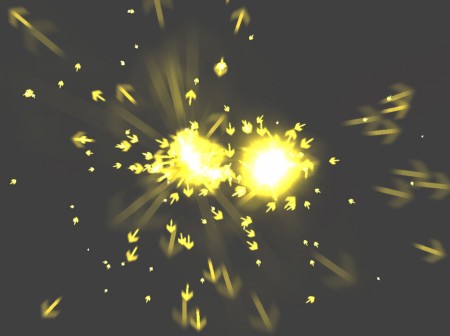
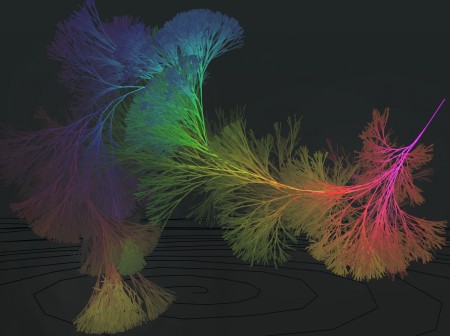
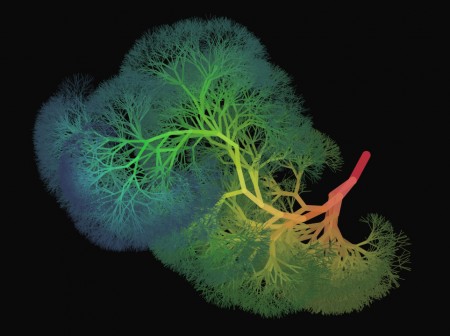
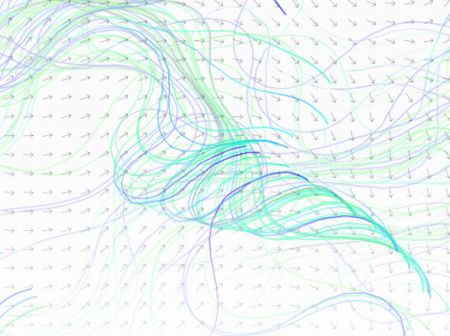
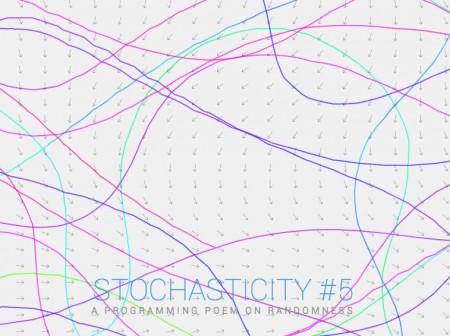
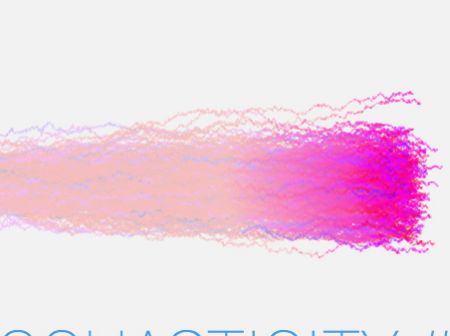
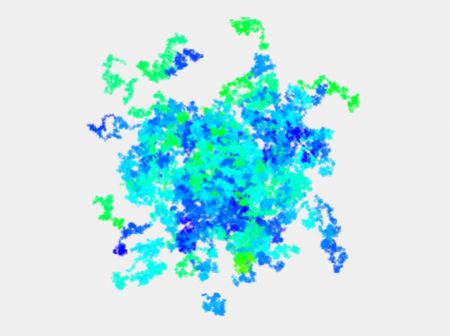
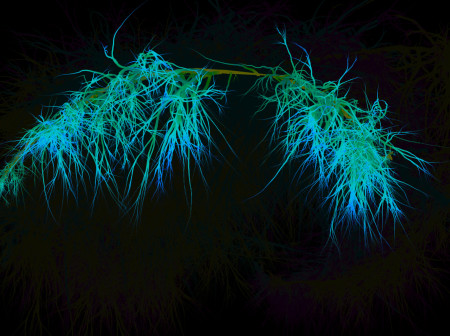
A favorite trick of mine is to take a multi-dimensional noise function, and then run parameters through it. I took a 3d simplex noise, then fed the X and Y screen coordinate into the first 2 parameters, and then the time through the final dimension. With this nice slowly changing and smooth noise value I determined the heading of the line. With this type of setup the lines tend to converge around the same points, which is aesthetically quite nice. Moving through the noise function over time means that the later generations of lines end up moving counter to the existing long lines creating a complex inner structure.
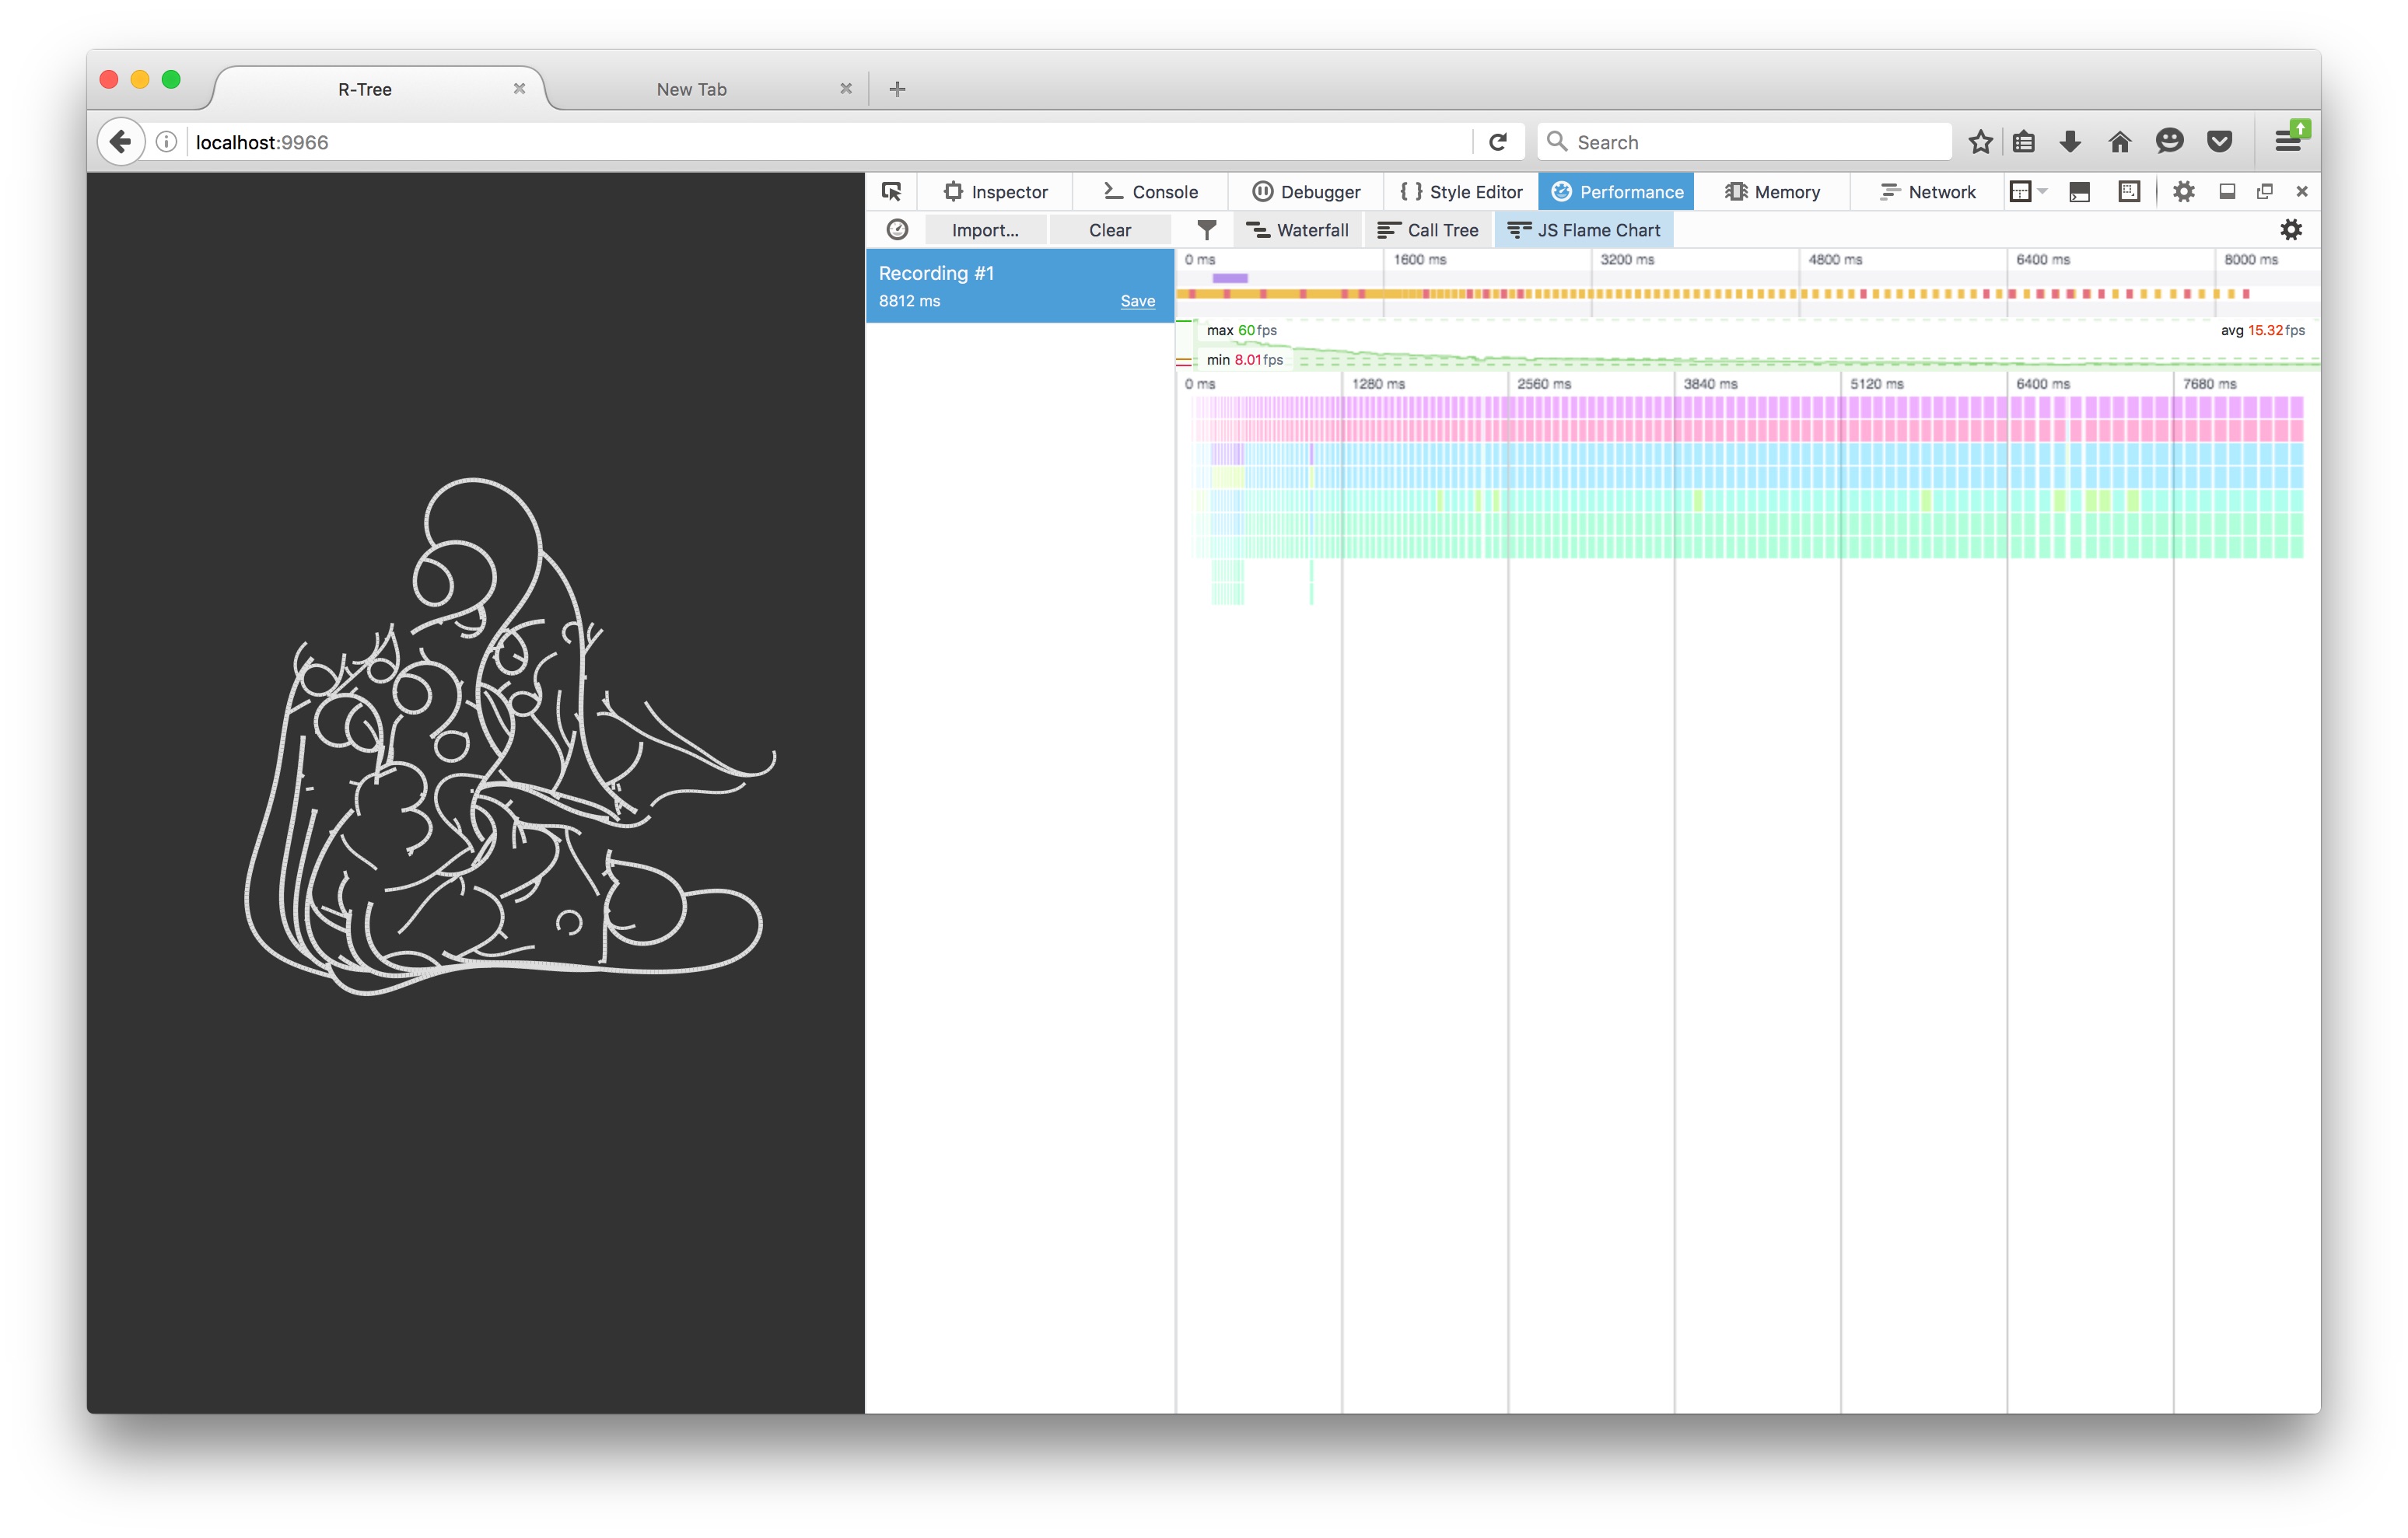
My initial attempts at solving this tangle of code end up having a pretty horrible performance bottle neck. My laptop probably got the hottest it’s ever been running on this piece, which is saying something. After doing some profiling I found that my draw calls were the limiting factors. I was re-drawing a complex structure in the browser every frame, which ended up being 10,000+ lines. This was a bad idea. Luckily the fix was pretty simple with only drawing the new lines and preserving the previous colors drawn. If the screen was resized then the entire structure has to be re-generated. This can be pretty brutal.
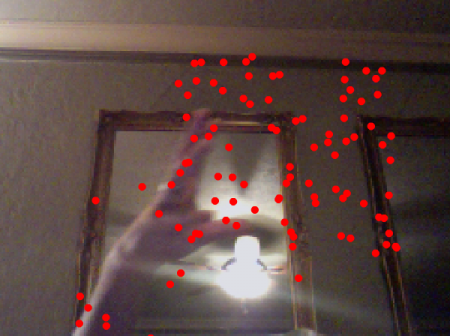
Notice how the FPS go down and down, being blocked by the rendering.
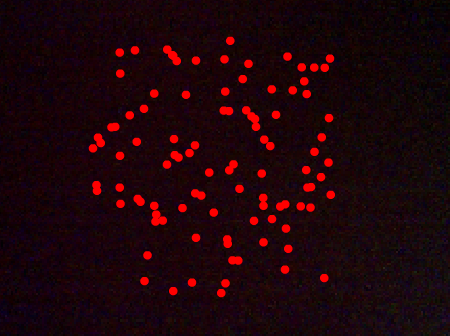
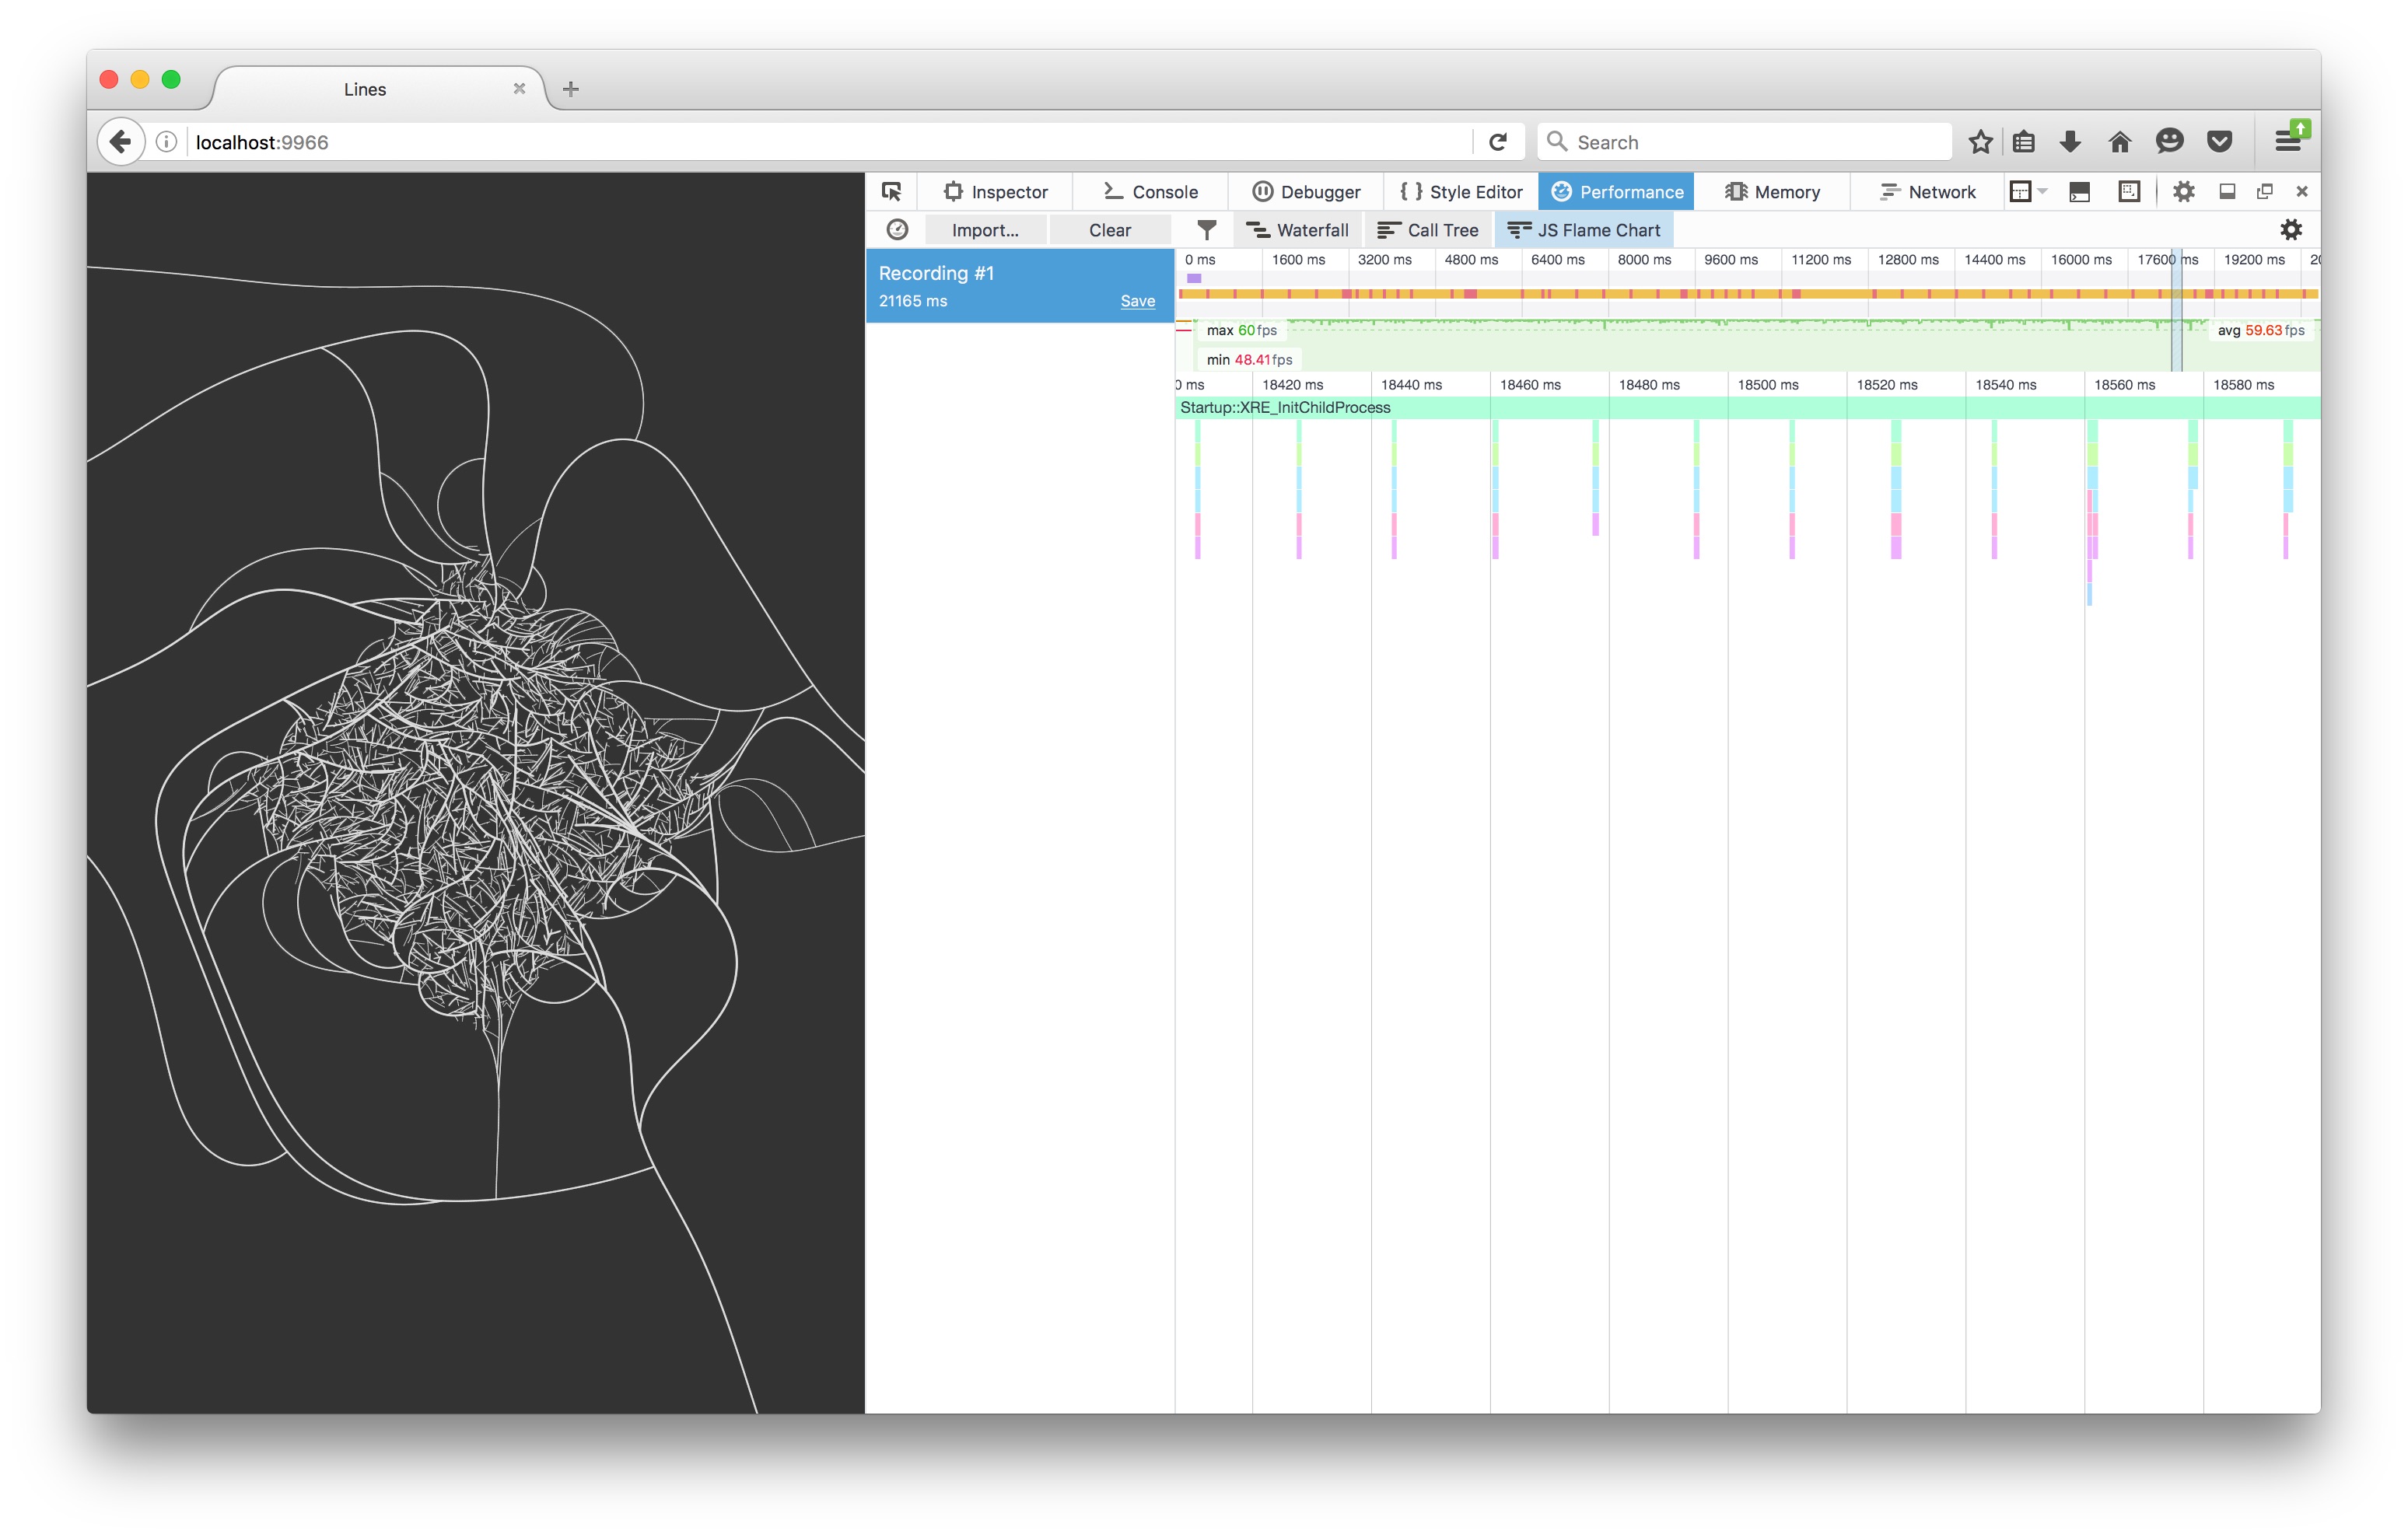
After the fix, it runs fast!
So now I had some pretty lines drawing on the screen that updated real-time. The next trick was ironing out any inconsistencies with being able to perfectly regenerate a simulation through multiple runs. I really like using psuedo-random number generators (PRNG) with my code. You can build something that ultimately is reproducible. The generator takes a seed value from the hash of the URL, or something random that gets logged to the console. If this value is fed back in then the visualization will perfectly be able to recreate the previous scene. This is a nice feature to build in from the beginning, and is easy as only using PRNGs. In my visualization hit the S key to save a random run to the URL to make it reproducible.
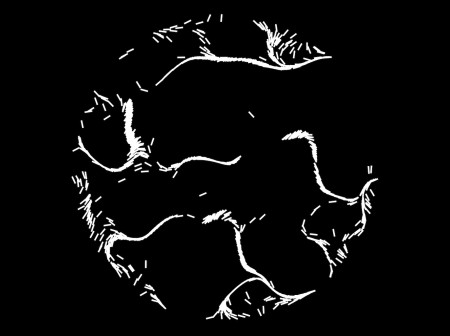
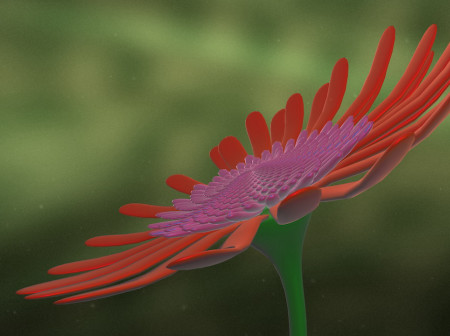
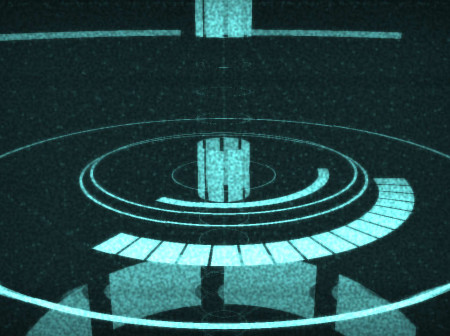
Finally I ended up mapping all of the position values to an idealized space of 0 to 1 in the X and Y directions. My visualization was dependent on the screen size to begin with, which was no good. I love the 0 to 1 range for visualizations because then you can scale arbitrary values as you see fit. And finally with my visualization I ended up using a rotation matrix to rotate the results into a diamond shape (it started out as a square).